July 2, 2026
I Turned Wikipedia Into a 3D City
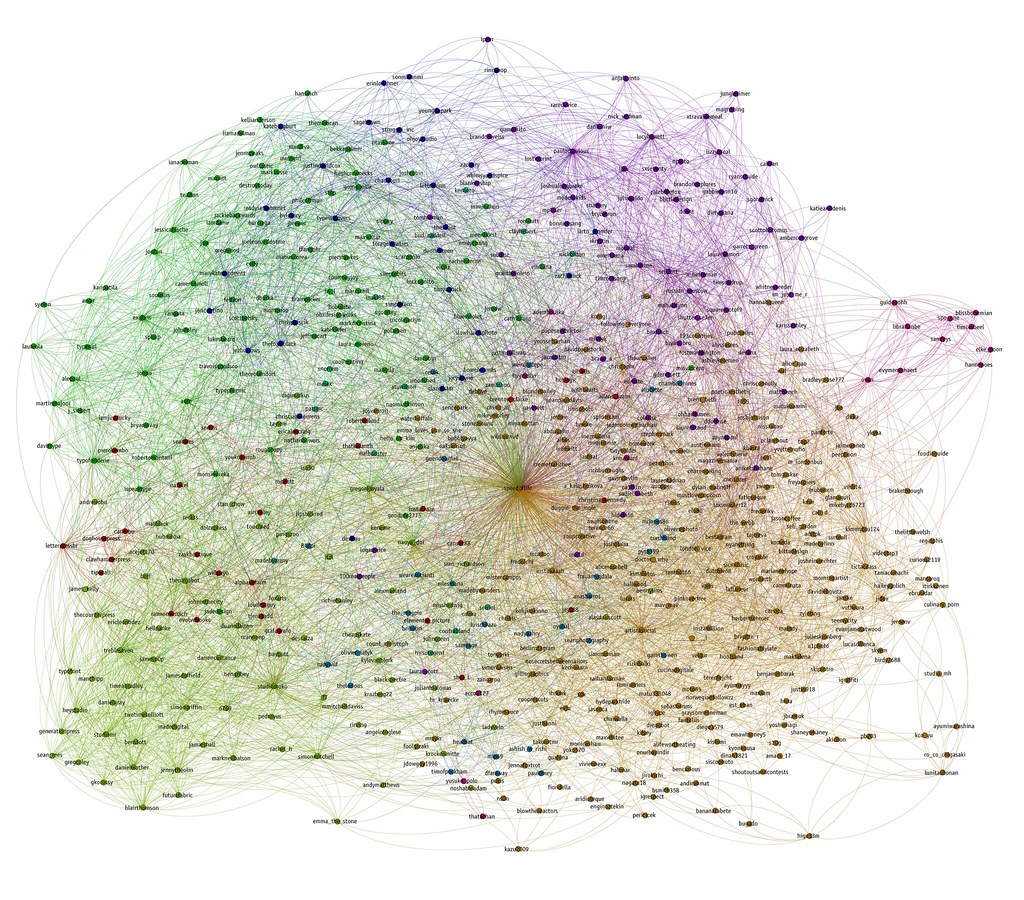
If you have ever tried to visualize a large network - a knowledge base, a social graph, a set of Wikipedia articles and the links between them - you have probably met the same monster I did: the hairball.
You drop your nodes and edges into a force-directed layout, hit render, and get back a dense gray cloud with a few labels leaking out of the edges. It looks impressive in a screenshot and tells you almost nothing. You cannot find a specific article. You cannot see structure. You certainly cannot explore it. Zooming in just gives you a smaller piece of the same tangle.
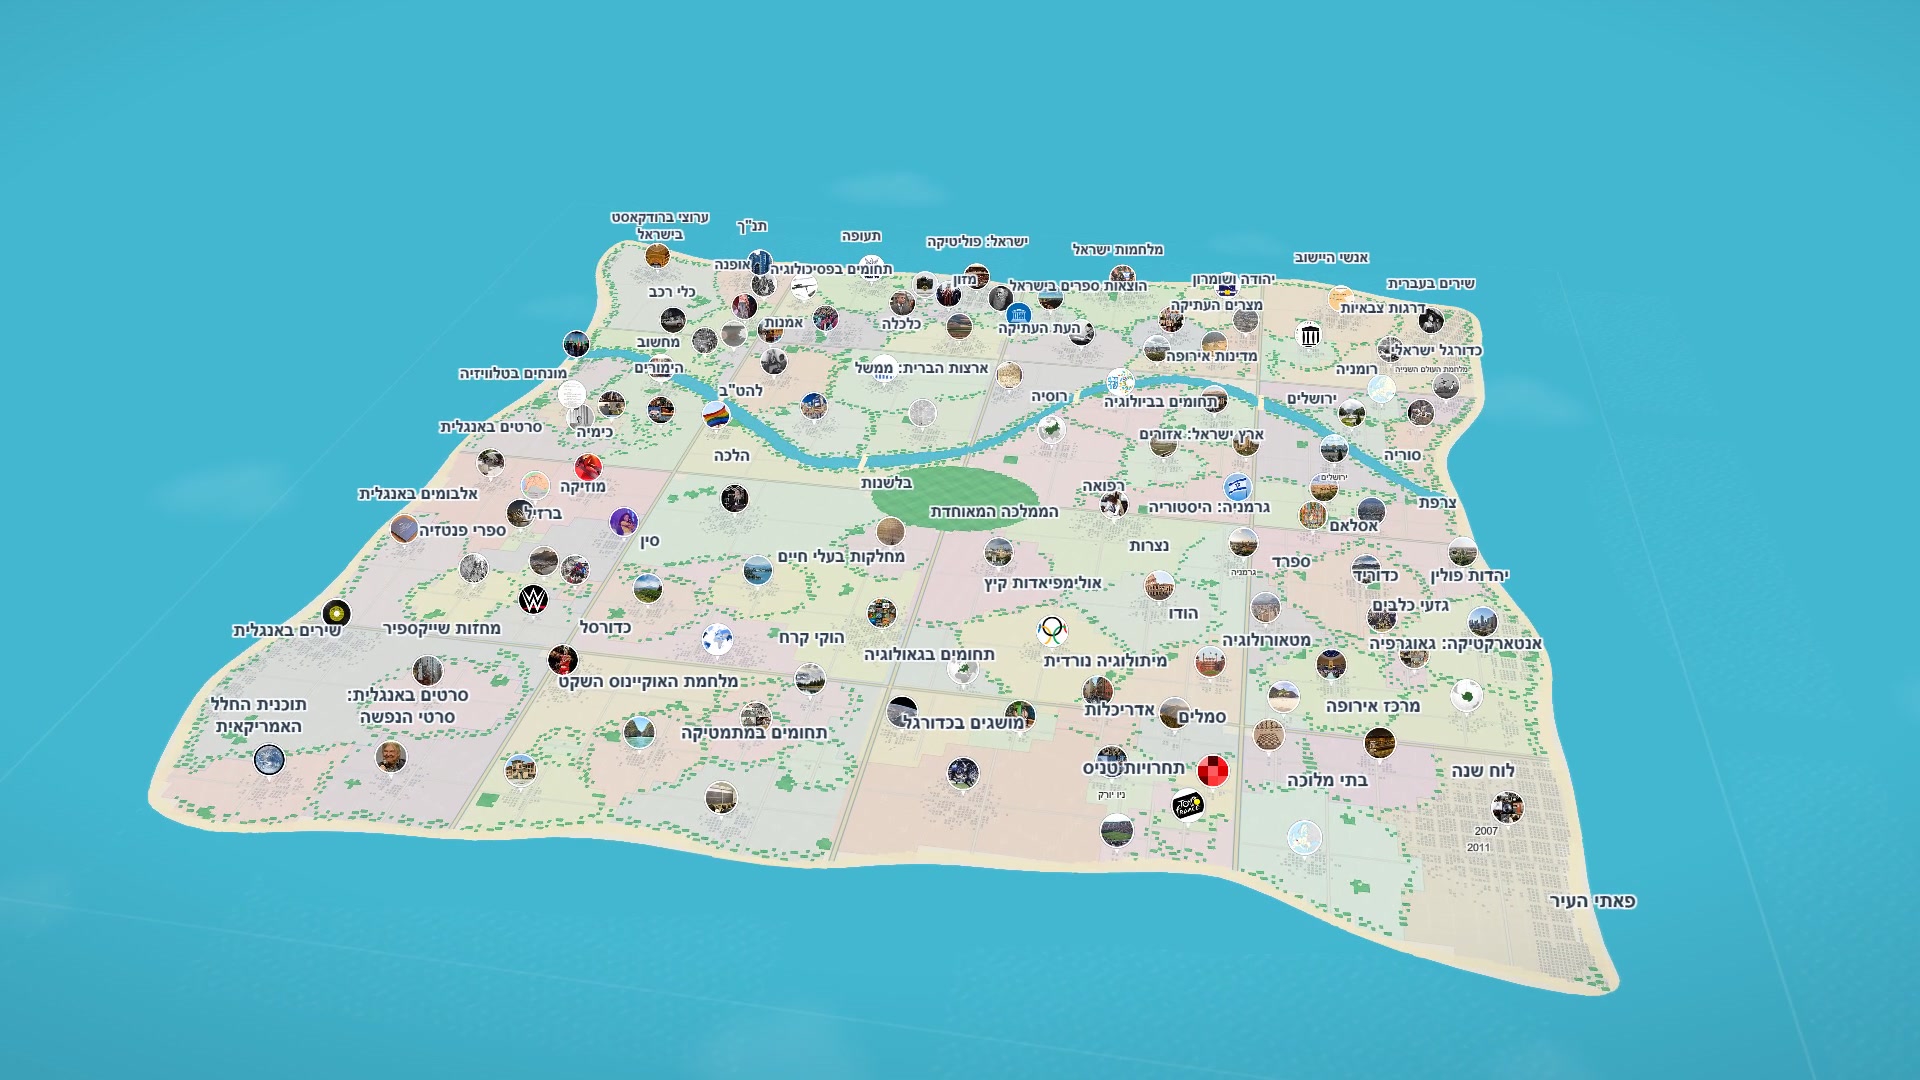
I wanted something better for the entire Hebrew Wikipedia - roughly 398,000 articles and the links between them. The hairball answers "what are the links?" I wanted something that answers "where am I, what's important here, and where should I go next?" - so I built a city. This is the story of what I built - and all the places where "nice," "true," and "fast" pulled in different directions.
Explore the live city → - fly through it, search it, and click into any building yourself.
The problem: a graph nobody can actually read
A network chart is the honest, literal answer to "show me the link structure." It is also, at this scale, useless. Force-directed graphs have three fatal problems once you pass a few thousand nodes:
- No sense of place. Every render is different, and nothing has an address. You can't say "meet me near the physics articles."
- No legible hierarchy. Important hubs and one-off stubs blur into the same fog of dots.
- No way in. There is no natural notion of zoom, of neighborhood, of landmark - the things humans actually use to navigate large spaces.
But humans are extraordinarily good at navigating one particular kind of large space: a city. We remember that the tall building is downtown, that the museum is near the park, that two neighborhoods sit across a river from each other. So the core idea became simple to state (and, spoiler, not so simple to build):
Every Wikipedia article is a building. Related articles cluster into neighborhoods. The whole thing is laid out like a real city you can fly through, search, and click into.
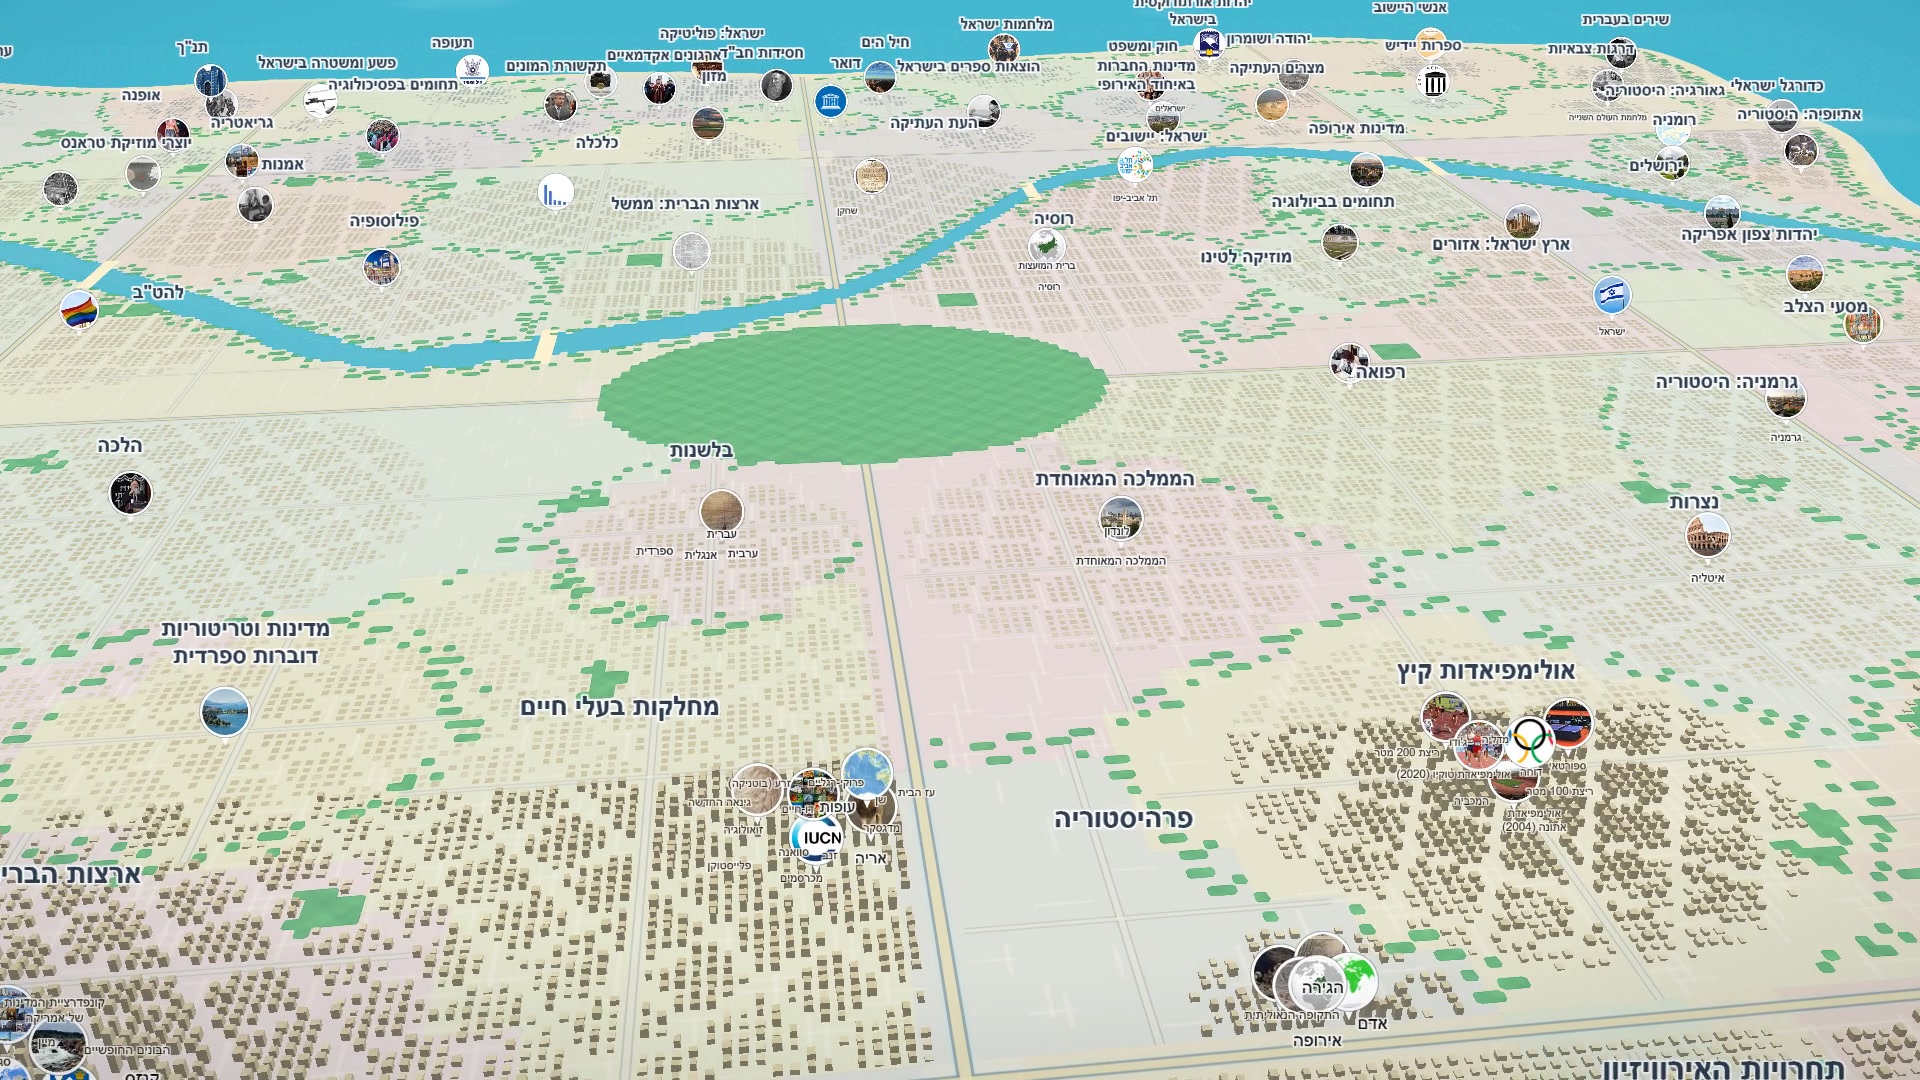
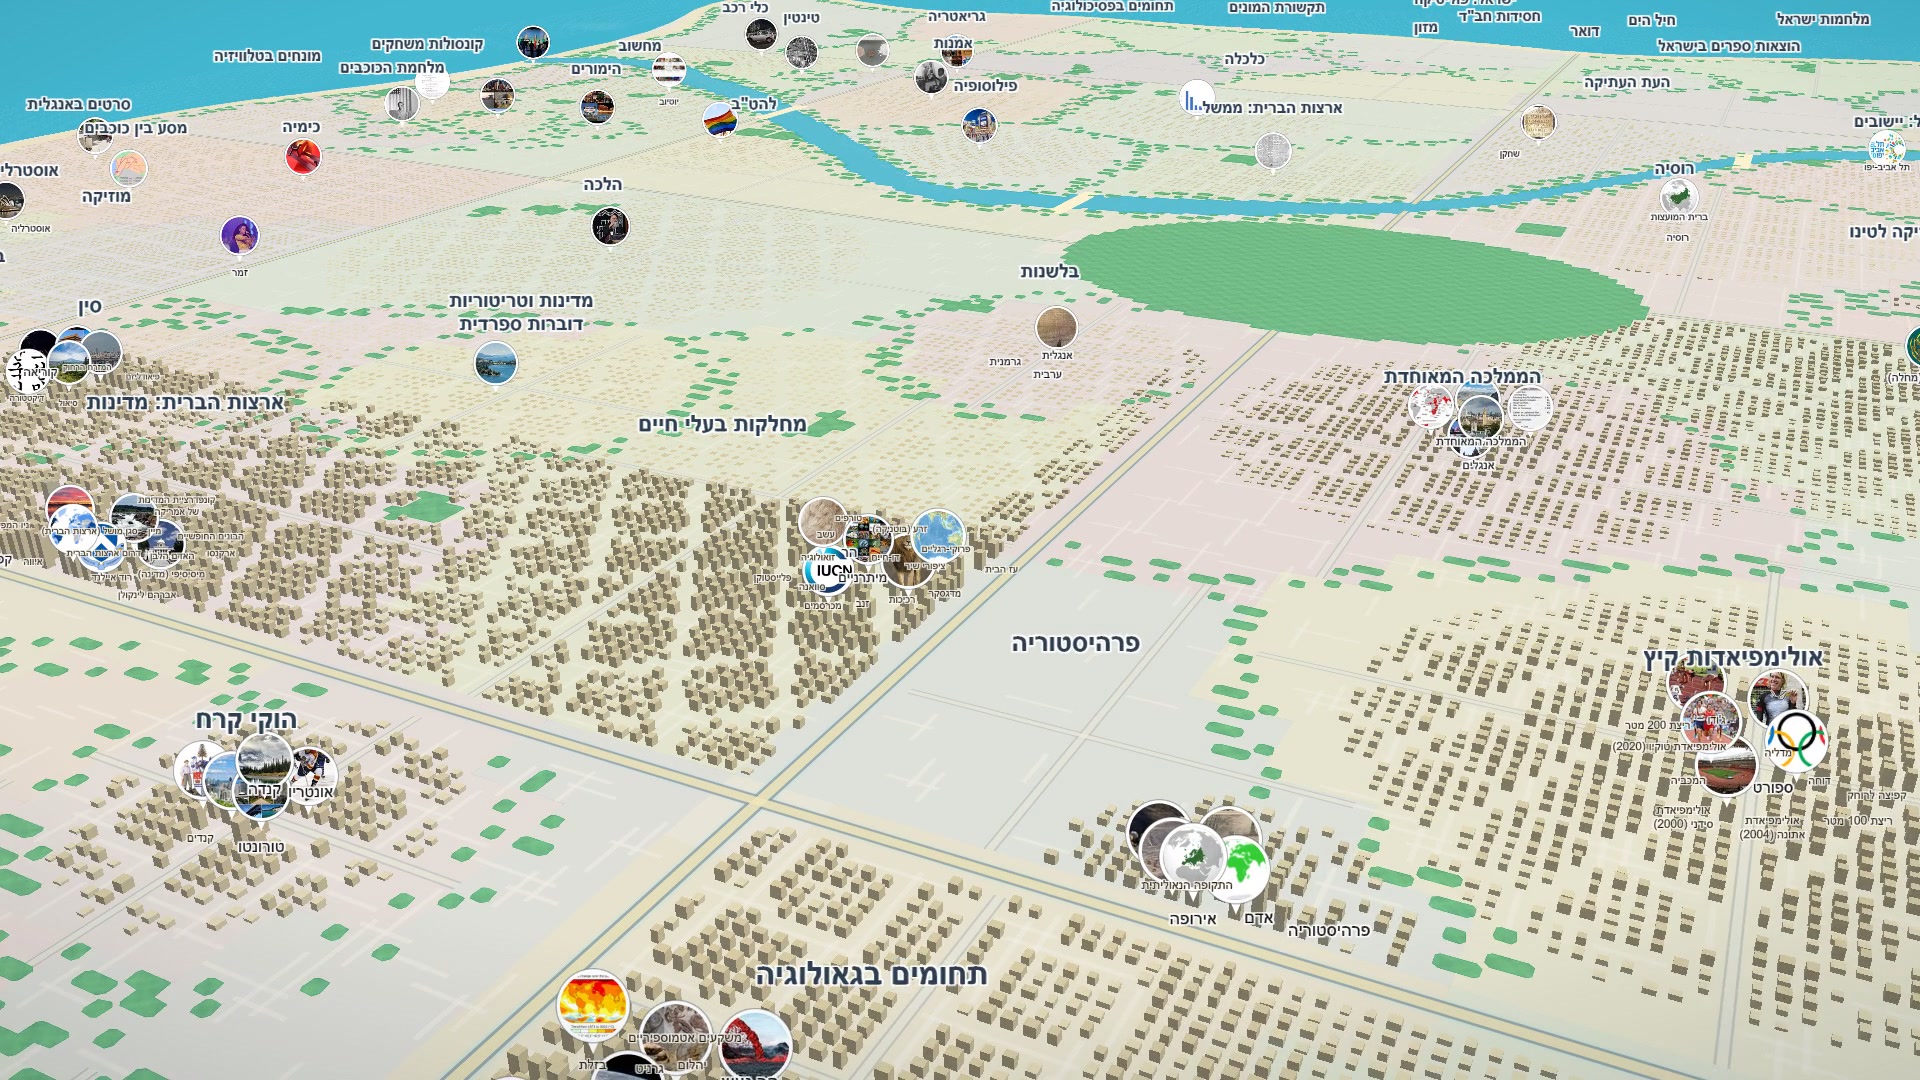
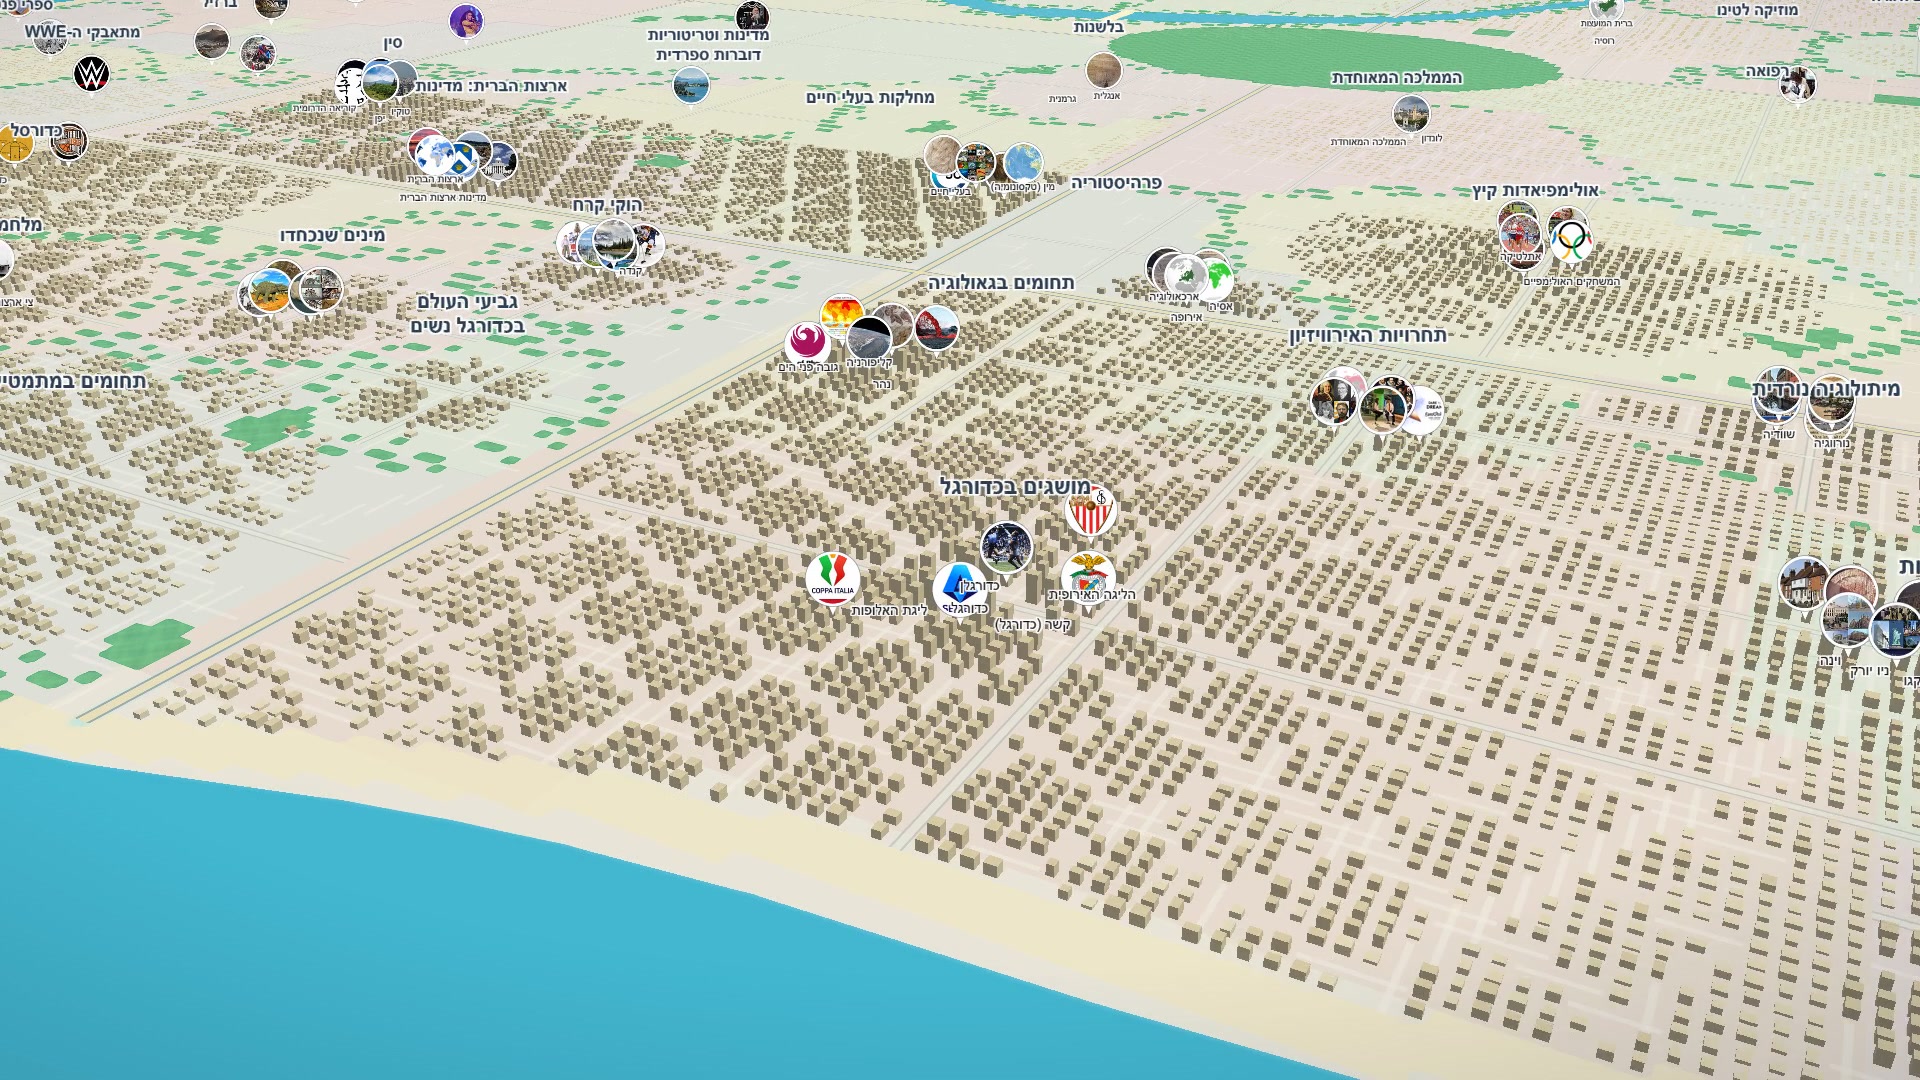
Height encodes importance - a building's number of floors comes from its incoming link count, so hub pages genuinely tower over the stubs around them. Neighborhoods are link communities - found with a community-detection algorithm (Leiden). Borders become roads. There's a central park, a winding river with bridges, and a coastline. And because it's a city, you already know how to explore it before you read a single instruction.
How it was built: a pipeline, one honest stage at a time
The project is really two halves. A data pipeline turns raw Wikimedia dumps into a handful of compact static files, and a web viewer renders them. Under the hood it became a chain of small, re-runnable stages, each cheap to run on its own, that carry the data from raw dumps to something the viewer can display.
Splitting it into cheap-to-rerun stages mattered enormously, because - as with any real dataset - the data was messy, and I had to actually read it to find out how.
The data was messier than the schema promised
The tempting shortcut was to build the link graph from Wikipedia's pagelinks table. It's right there, it's structured, it's a clean join. I used it first. It was wrong.
pagelinks records links after template expansion. That means every shared template - the navigation boxes and reference widgets stamped onto thousands of articles - injects the same links everywhere it appears. The graph that comes out isn't "what articles are topically related" - it's "what templates got transcluded a lot." The real topical signal was buried under boilerplate.
So I threw that out and did the harder, more honest thing: parse the wikitext source itself and keep only the [[links]] a human deliberately typed. Template transclusions show up as {{...}} and contribute nothing to the graph. That single decision is what makes the neighborhoods mean something.
You could see the difference in the very first render. Before I cleaned any of this up, the tallest towers in the city weren't ideas - they were news sites. Ynet loomed over the whole skyline, with other outlets close behind, because nearly every article cites its sources, and every "source: Ynet" link counts as another article pointing at Ynet. That's citation plumbing, not topical relatedness. So reference and source links went in the same bin as templates - excluded - and the skyline suddenly started to look like knowledge instead of a media kit.
Reading real Hebrew wikitext, byte by byte, is where the messiness really lived:
- The raw dumps fight you. Hebrew titles are full of punctuation that breaks naive parsing, so off-the-shelf splitting quietly corrupts them. I ended up writing a small tokenizer of my own just to read the dumps without mangling names.
- A link isn't always a link. The links I was hunting for hide inside comments, code blocks, and math, where they never actually render. Some nest inside others - a captioned image can contain its own links - and plenty are disguised by encoding or stray whitespace. Every one was a real edge case I only found by reading the content, not the schema.
- Not every page is a place. Calendar pages - years, dates, months - link to each other constantly and would form a giant fake super-neighborhood. Detecting them needs careful Hebrew regexes, because a lazy one happily matches acronyms like תנ"ך. Rather than delete them, I let them keep their own "לוח שנה" (calendar) district - a real neighborhood off to the side, whose tallest tower is, fittingly, a single year: 1945. Articles nobody links to, meanwhile, become "פאתי העיר" - the outskirts.
None of this is glamorous. But it's the difference between a map of Wikipedia and a map of Wikipedia's templates.
Where nice, true, and fast disagreed
Once the data was trustworthy, the interesting work became a series of trade-offs. Three of them shaped almost every decision.
1. A beautiful city vs. an accurate one
This is the central tension of the whole project. A pure data visualization wants to be faithful: put every point exactly where the numbers say. A city wants to be beautiful and legible: organic neighborhoods, roads that make sense, a skyline you enjoy looking at. These goals disagree constantly.
A few of the places I had to negotiate between them:
- Layout. I didn't just scatter buildings by coordinates. Districts are placed with a weighted graph layout of the community meta-graph - so related neighborhoods end up adjacent - and then grow outward as organic regions on a shared grid via capacity-constrained region growing, claiming free cells until each fits its members. The result reads as a real city, while the adjacency still reflects genuine link structure.
- Heights. Raw in-degree is accurate but ugly - a few absurd spikes and a flat carpet of everything else. Instead, floors follow a curve tuned to look like a real city's skyline: most buildings just a few floors, a handful of one-to-two-story stubs, and rare skyscrapers towering over the rest. It's still monotonic in importance - bigger really does mean more-linked - just shaped to be readable.
- Two different link graphs for two different jobs. For clustering, I downweight ultra-common link targets and lean on the rarer connections, so a link through some niche article counts for far more than one through a giant hub. But for heights and labels, I keep the true, unfiltered in-degree. Accuracy where it's a fact; gentle massaging only where it's an aesthetic. The consequence is sometimes just funny: the single tallest building in the entire city isn't Jerusalem or Einstein or the Second World War - it's ראשי תיבות, the article explaining Hebrew acronyms, because a staggering number of pages link to it. I left it standing. Honest data occasionally has a sense of humor, and sanding that off would have been its own kind of lie.
- City furniture. Borders between districts become arterial roads; every few grid lines becomes a local street; there's a coastline, a winding river with bridges, parks, and a central park. All of it is generated, but the parts that encode data - membership, adjacency, and importance - stay grounded in the graph.
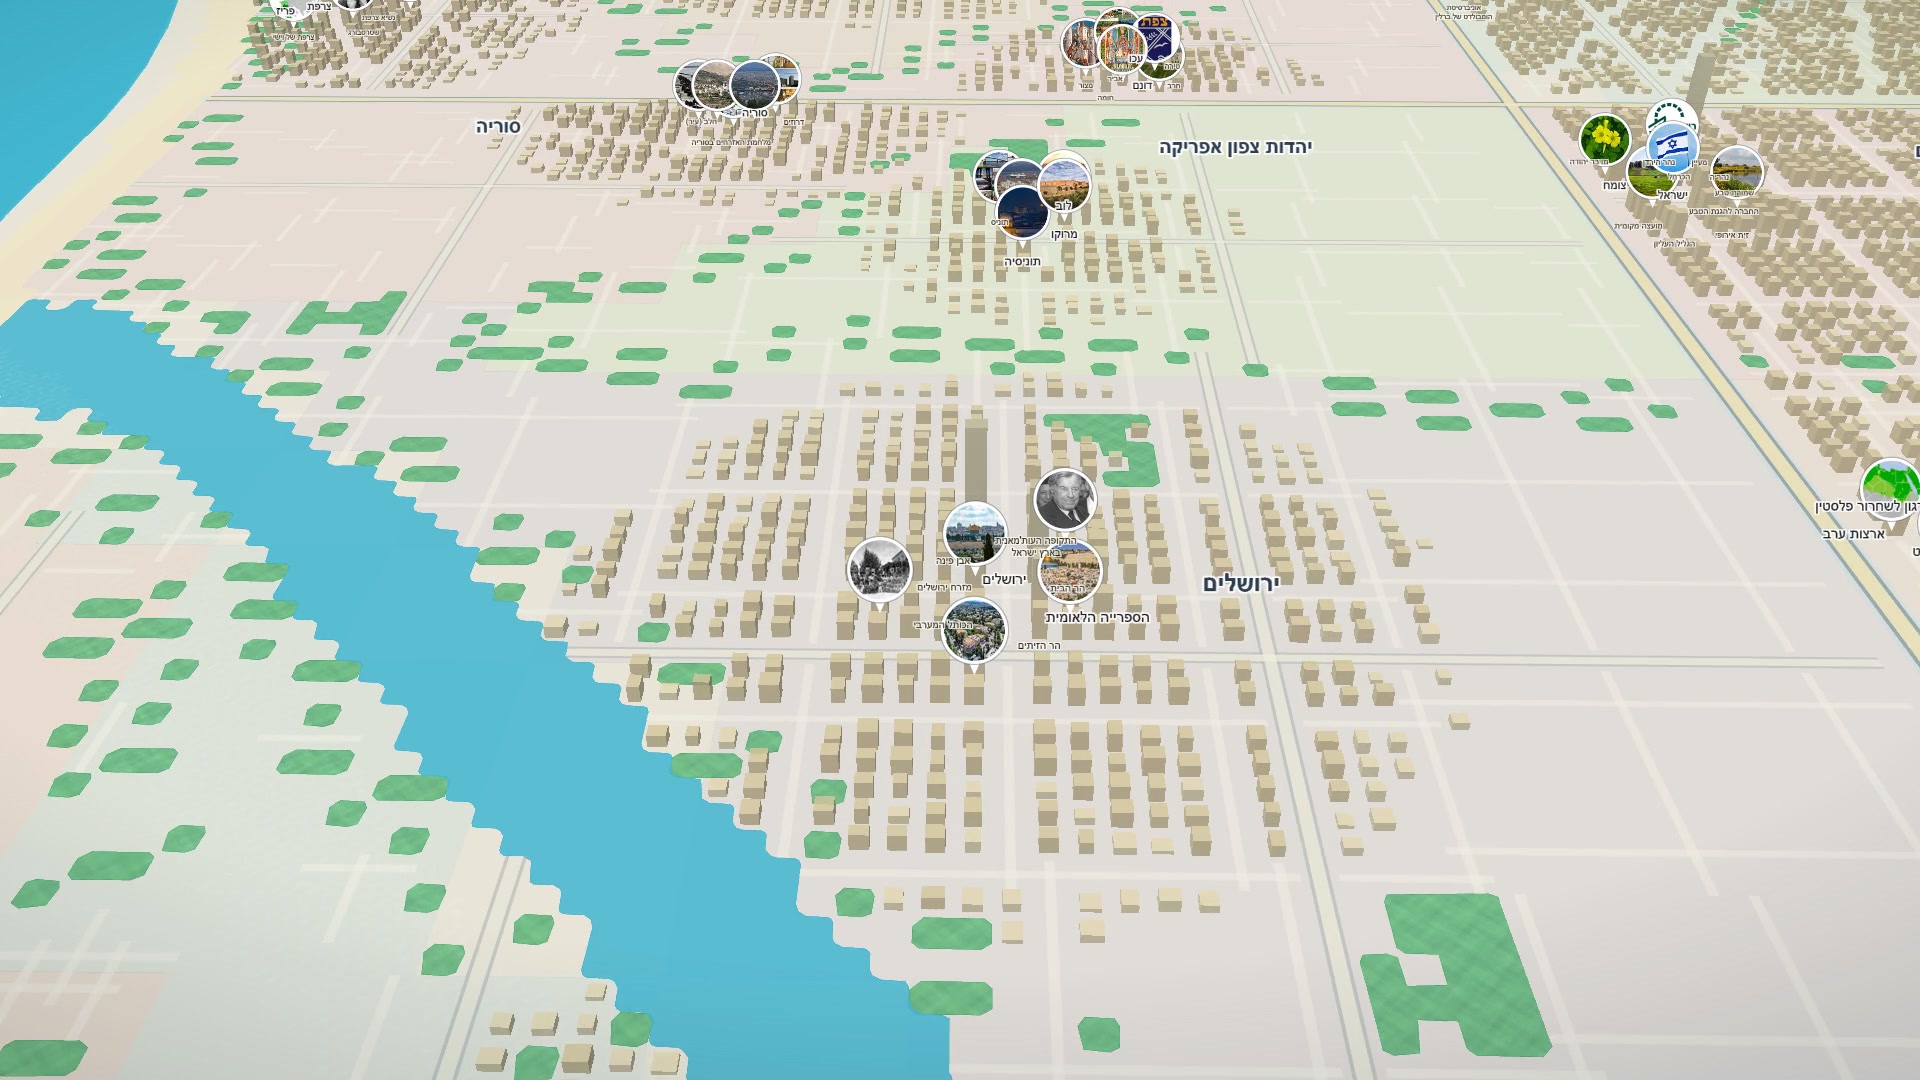
My rule of thumb throughout: let the geometry be pretty, but never let it misrepresent a number. Importance, adjacency, and membership stay honest; everything else is free to look nice.
2. Naming neighborhoods without a human in the loop
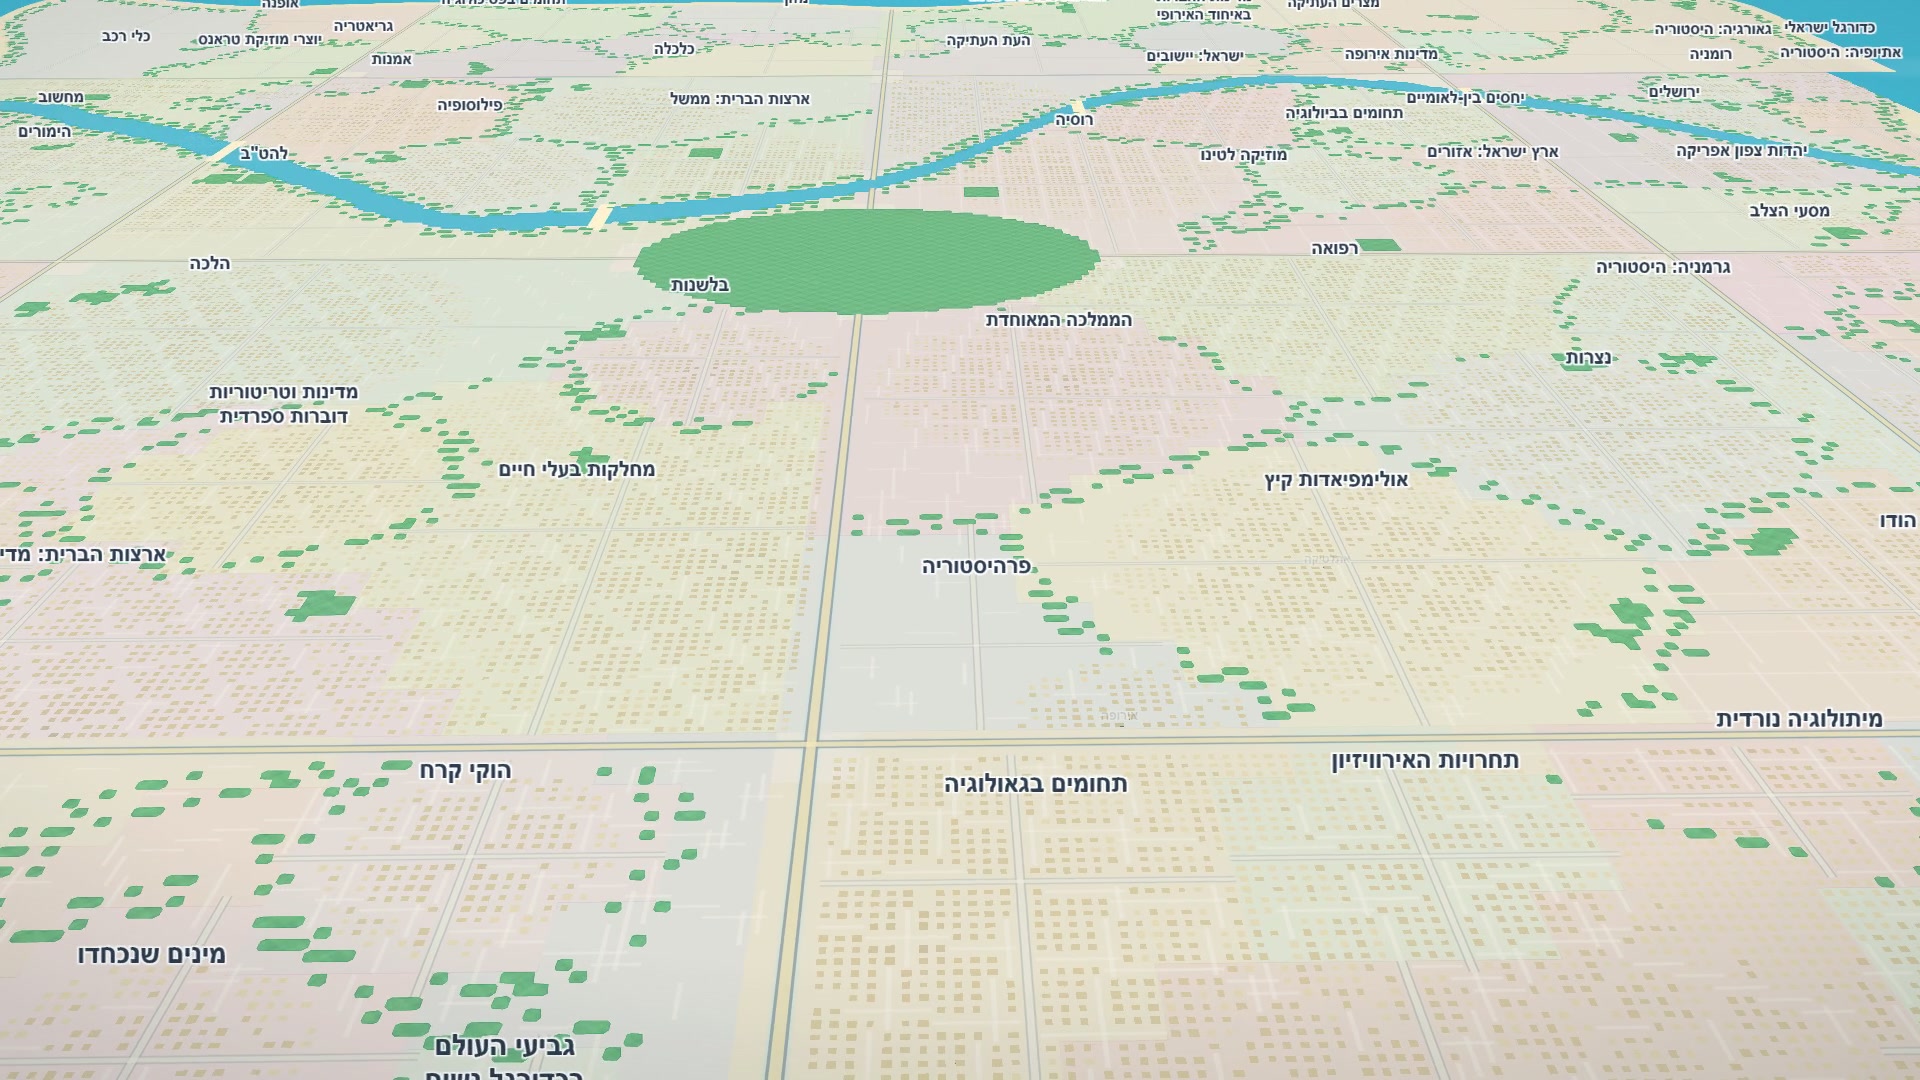
A city needs neighborhood names, and I have ~140 of them. Naming each district after its single most-linked article felt arbitrary. So the default names each district after its most distinctive shared Wikipedia category instead. It's a small feature that does a lot of work to make the city feel like it was labeled by someone who understood it.
3. Making ~400k buildings load - and stay smooth at 60 fps
Faithful and beautiful still isn't enough if the page takes 40 seconds to load or stutters when you move the camera. The whole point is exploration, and exploration dies the moment interaction gets janky.
The performance work happened on both sides of the wire:
- Compact artifacts, not JSON. The pipeline exports packed binary files rather than verbose text, and bakes districts, water, parks, roads, and all ~400k buildings into one compact archive.
- Tiles carry references, not text. The vector tiles only store a lightweight reference per building; titles are resolved separately. That keeps the tiles tiny and avoids shipping hundreds of thousands of strings you can't even see yet.
- A timeline that filters, not reloads. A slider filters articles by creation date - press play and watch the city build itself from 2003 to today as articles get written. Since exact creation dates aren't in the dumps, they're estimated from sequential page IDs, calibrated against ~400 real first-revision timestamps sampled from the API (with a politeness delay so I don't get rate-limited). Another small accuracy-vs-practicality trade: estimated, but calibrated, and cheap enough to animate.
If you're staring at your own hairball
A few things I keep coming back to:
- A messy graph is usually a modeling problem, not a layout problem. No force-directed algorithm was ever going to save that first graph, because the graph itself encoded the wrong thing. Fixing what an edge means mattered far more than how I drew it.
- The interesting bugs live in the content, not the schema. The tokenizer, the nested-link edge cases, the calendar-page regexes, the news-site towers - none of those were predictable from the table definitions. They only turned up once I was reading the actual bytes Wikipedia serves.
- Pick a metaphor your users already know. "It's a city" bought me an enormous amount of built-in intuition - zoom, neighborhoods, landmarks, addresses - for free. The best visualization is one people can navigate without a legend.
- Be explicit about where you traded truth for beauty, and where you didn't. Heights are shaped for the skyline; in-degree for labels is exact. Naming those choices out loud keeps the whole thing honest.
The hairball was never going to answer "where am I, what's important here, and where should I go next?" - and it turns out that was the question people actually had all along. A city answers it before you read a single instruction.
What's next: English Wikipedia
Hebrew Wikipedia's ~398,000 articles were the proving ground. The obvious next city - and what I'm working on now - is English Wikipedia: more than 6 million articles, a roughly 15× bigger graph that breaks almost every shortcut I leaned on here. Building a walkable metropolis at that scale is the real test of whether the whole approach holds up.