January 15, 2023
How Many People Hear Your Honk?
Building a tiny Tel Aviv map that makes urban noise visible.
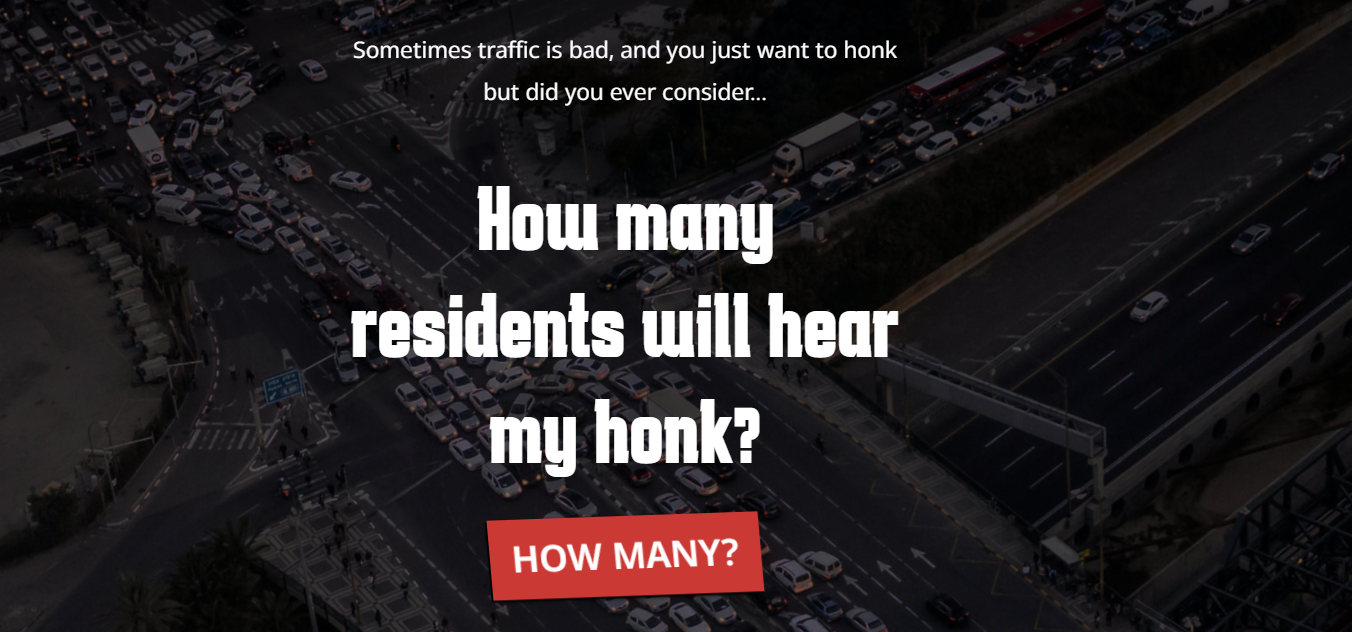
The app is deliberately silly, but the question behind it is real. You can try it here: carhorn.yaronshemesh.com.
The problem I wanted to solve
If you've ever sat in Tel Aviv traffic, you know the sound. Someone two cars back leans on the horn as if the volume will make the light turn green faster. It almost never helps the honker - but it definitely reaches a lot of people who had nothing to do with the jam.
That's the thing that bugged me: honking is a fundamentally antisocial act, but it's completely invisible to the person doing it. You honk, the sound travels, and dozens of people in the surrounding buildings hear it - but you never see them. There's no feedback loop. Nothing makes the cost of that one impatient press feel real.
So I set out to build the feedback loop. I wanted a tiny web app that answers one question as concretely as possible:
"How many residents would actually hear your honk?"
Pick a spot in the city, pick your vehicle, and get a number - plus a playful little guilt trip: annoyed faces popping up around the buildings nearby.
The core insight: public data can make invisible things visible
The whole project hinged on one realization: the raw material for making that invisible audience visible was already sitting in a public dataset. The Tel Aviv Municipality publishes open GIS data, including building footprints and one very useful number for every building: how many floors it has.
That was the unlock. I didn't have population-per-building data, which is hard to get in a usable public form - but I did have floor counts. And floors are a decent proxy: if I assume some average number of residents per floor, I can turn "buildings near the honk" into "people near the honk."
I settled on a deliberately simple model:
affected residents ≈ (sum of floors in every building within the horn's radius) × 3
Three residents per floor. Is it exact? No - and I say so openly in the app's FAQ. But it's transparent, easy to inspect, and good enough to make the point. The goal was to make an invisible thing tangible, not to publish a demographic study.
How I built it
The app is a small web app that runs entirely in the browser, and honestly most of the effort went into the experience rather than the logic. The calculation itself is a few dozen lines; the storytelling around it is where the work was.
The interaction is intentionally simple: splash screen, choose a horn, click the map, watch the sound radius expand, and see the result.
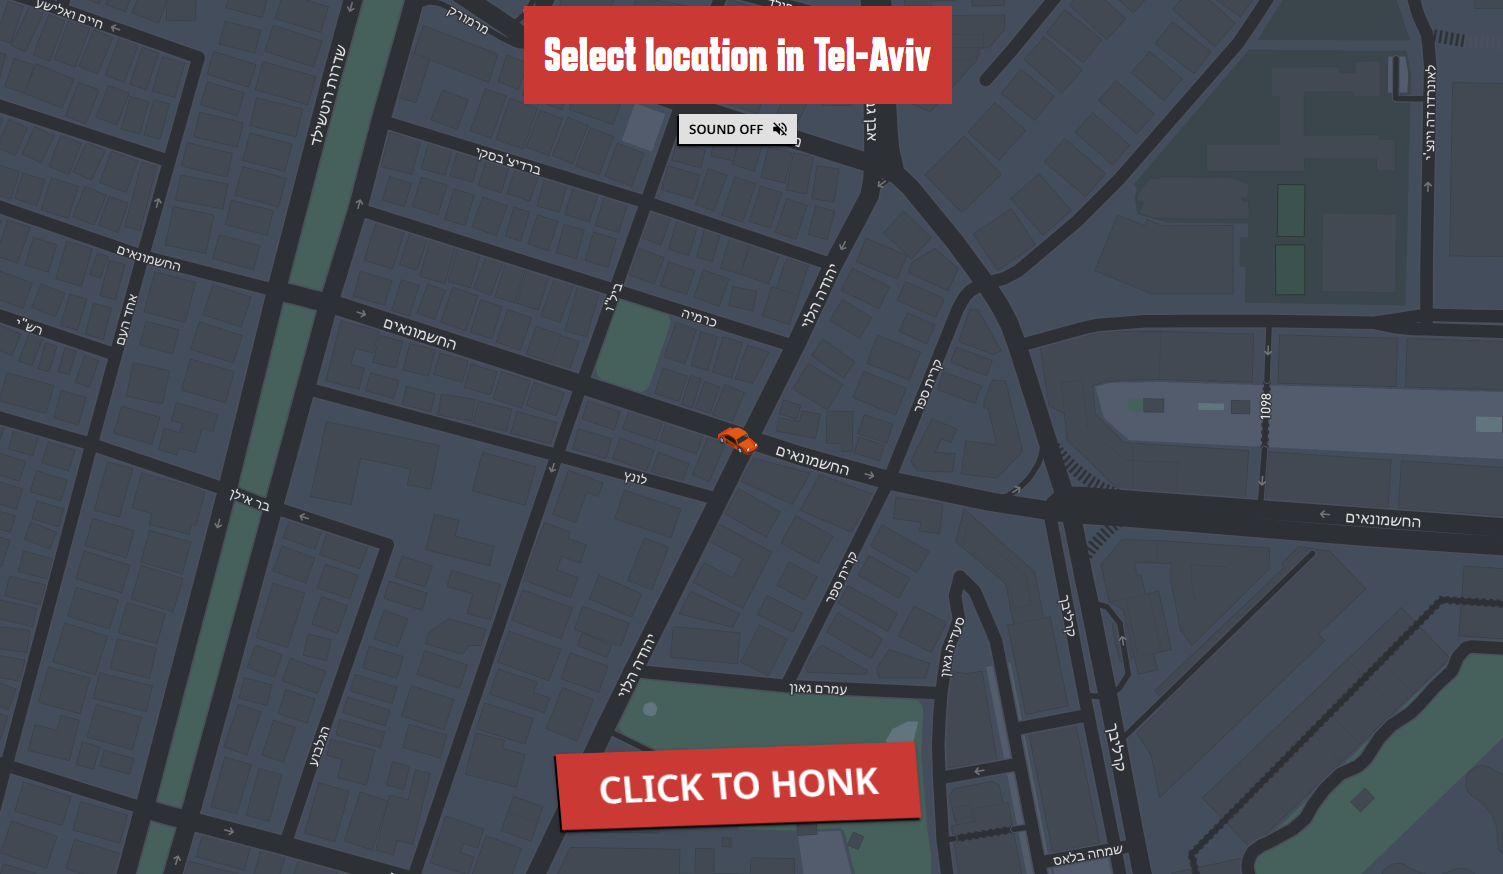
The map itself is interactive and draggable, with a nicely styled look rather than a plain generic map. A few touches made it feel like a purpose-built toy:
- Everything outside the Tel Aviv boundary is greyed out, so the city is literally the only place you can play.
- An expanding circle represents the sound wave rippling out from the honk, timed to the vehicle you picked.
- Once the calculation finishes, the affected buildings light up red, a counter races up to the total, and a scatter of angry cartoon faces appears over the rooftops. That last part is pure comedy, and it's the part people remember.
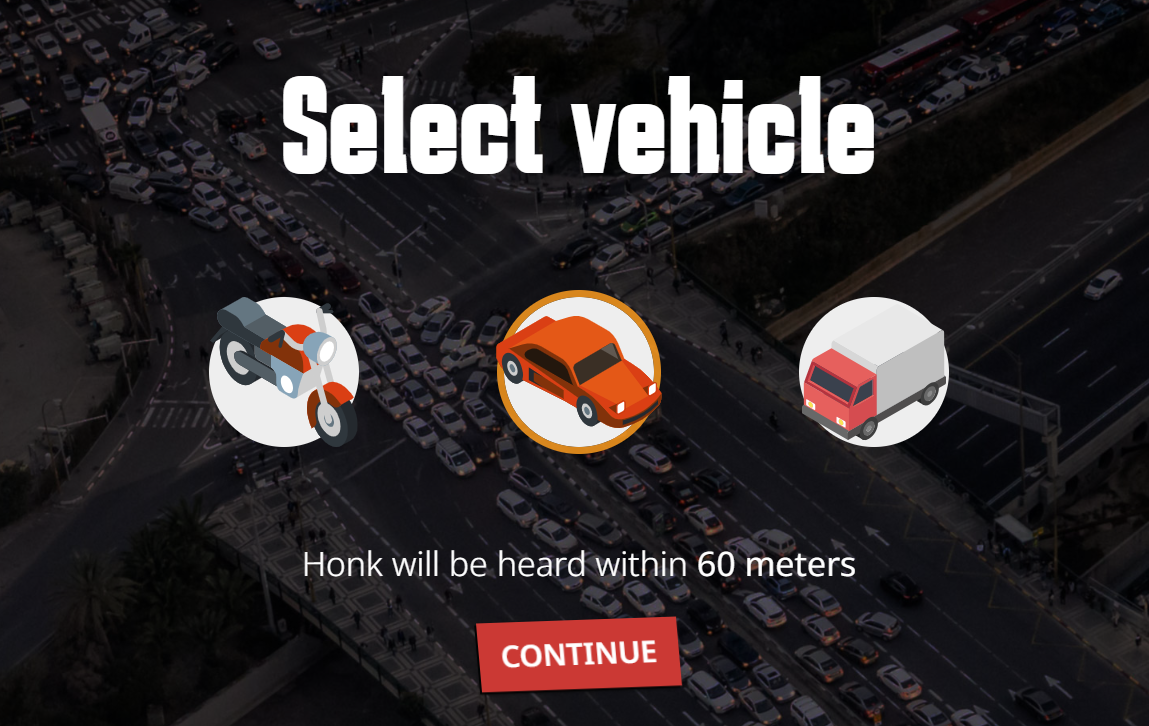
Each vehicle has its own personality - a motorbike, a car, and a truck, with progressively larger audible radii (30 / 60 / 80 meters) and their own horn samples. Bigger vehicle, bigger blast radius, more annoyed neighbors.
Then you just click anywhere in the city to drop your vehicle and honk:
The challenges
1. Getting live data without a backend
I wanted real, current building data - but I didn't want to run a server. The solution was to ask the city's public map service directly from the browser for every building inside a circle around the clicked point, and read back each building's outline and floor count.
That works beautifully… until the service is slow, unavailable, or rejects a request. So I built a fallback: a snapshot of the building data shipped with the app, which the browser can filter on its own - for each building it just checks whether it falls inside the honk's radius. The app tries the live service first and silently drops to the offline snapshot if anything goes wrong. Either way the result looks identical, so the rest of the app doesn't know or care which path ran. This is the pattern I'm happiest with in the whole project - it lets an app with no backend stay resilient.
2. Coordinates and geometry math
Maps mean constantly converting between meters and degrees of latitude/longitude - which aren't the same thing, and depend on where you are on the globe. The radius math and lining the resident icons up over buildings took more fiddling with cosines than I'd care to admit.
3. Making it feel good, not just work
The first working version calculated correctly and felt completely flat. A number just appeared. It was the animations - the sound ring expanding at the right pace, the counter ticking up over five seconds, the delay before the angry faces appear, the drop sound when you place your pin - that turned a correct app into a fun one. Getting that timing right, so the payoff lands at just the right moment, took far more tweaking than the actual math ever did.
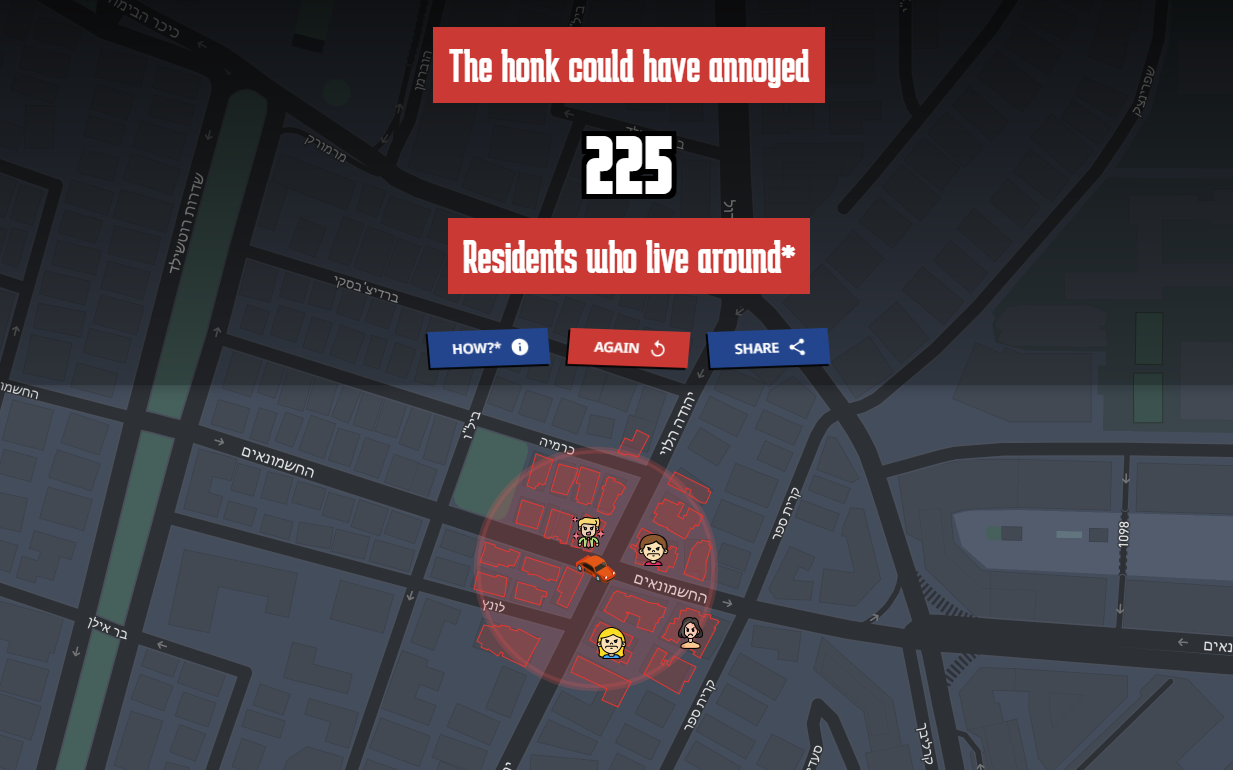
The payoff: the red radius, the running count, and the little annoyed neighbors - this is the whole point of the project in one screen.
4. It went viral, and the map bill did too
This is my favorite disaster from the project. For the map's look I used Mapbox - beautiful custom-styled tiles, easy to set up, and free up to a generous limit. I knew it could cost money past that limit, so I wasn't careless about it: I was watching the usage as the app started to spread.
Then it went viral, and the numbers moved faster than I did. Thousands of people were loading the map, every one of them pulling tiles on my account, and Mapbox bills by usage. I saw it climbing and swapped the paid Mapbox tiles for a simpler OpenStreetMap-based layer. I thought I'd caught it in time. I hadn't. The bill still landed: $125. Not ruinous - but a project that was free for every user had quietly become a project that charged me per honk, and that reframing is what stuck with me. Nobody sends you an invoice for succeeding at a hobby. Mapbox did.
In fairness, this was years ago, and it taught me a lesson I've kept ever since: watching a meter isn't the same as being protected by one. If a hobby project can suddenly get popular, don't put a pay-per-use third-party service on the critical path at all. These days I reach for self-hosted map tiles instead, so a spike in traffic is at least something I control - not a surprise invoice from a third party.
Key takeaways
- The best data-viz projects start with data you already have. I didn't build this and then look for data - I found the floor-count data and the project fell out of it. A single interesting public dataset is often the whole idea.
- A rough model that's honest beats a precise model that's opaque. "3 residents per floor" is a guess, and admitting that in the FAQ made the whole thing more credible, not less. Transparency is a feature.
- The timing is where the point lives. The project is emotional - "look how many people you bother." The math alone doesn't land that; the expanding ring, the counter that takes five slow seconds to climb, the beat of silence before the angry faces pop up - that's what makes it register. Polish wasn't decoration here, it was the message.
- Don't put a metered, pay-per-use service on the critical path of something that might go viral. A free tier is only free until you're popular. The map bill taught me to prefer free or self-hosted infrastructure for hobby projects, so success can't hand me a surprise invoice.
- Constrain the playground. Masking everything outside Tel Aviv turned a limitation (I only had data for one city) into a deliberate, focused design.
What I'd do next
The obvious next step is more cities - but that depends entirely on other municipalities publishing the same kind of open building data, which is exactly why the app is Tel Aviv-only today. Beyond that, the model could get smarter: decay the effect with distance instead of using a hard circle, factor in time of day, or account for how many people are realistically home. But I'd keep it a toy. The moment it stops being playful, it stops making its point.
This is the kind of project I love: not because the model is perfect, but because it turns public data into something people can immediately feel. A spreadsheet about buildings became a tiny urban mirror.